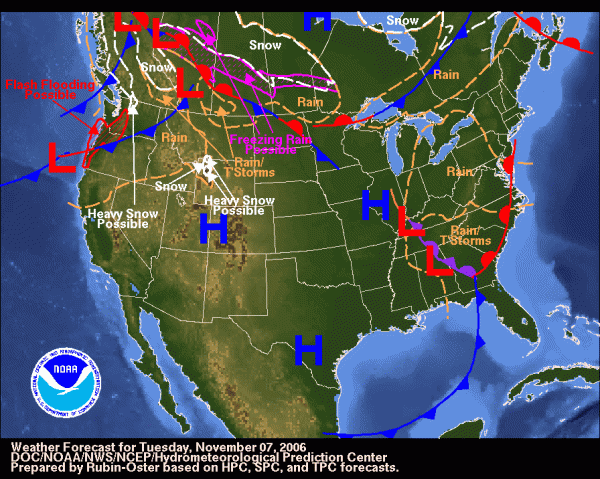

A weather report is a prediction of weather, often for a specific locality, in a newspaper, on the radio or television. The weather is predicted through application of the principles of Physics and meteorology.
Example A Weather Report
Good morning. This is Fandy Christian with local weather report. It will be foggy this morning in almost all parts of town, followed by slight showers. However, the showers will not last for a long time. By early afternoon it will be sunny until late afternoon, followed by heavy rain in the evening into the night. Thank you.
Tables/Graphs
Tables and graphs can be useful tools for helping people make decisions. However, they only provide part of a story. Inferences often have to be made from the data shown. As well as being able to identify clearly what the graph or table is telling us, it is important to identify what parts of the story are missing. This can help the reader decide what other information they need, or whether the argument should be rejected because the supporting evidence is suspect.
TABLES
Table presents facts and fiures in compact form. There are several things that we need to pay attention to. They are, the table title, row or column labels, information given in individual cells and information given within rows and columns.
Examples:
GRAPHS
A graphs is a visual, concise means of presenting information. There are three basic kinds graphs: b line graphs,circle or pie graphs and bar graphs.
1. Line graphs: A line graph is a way of representing two pieces of information, which is usually related and vary with respect to each other. This is useful when comparisons are needed

2. Pie Charts: A pie chart is a type of a circle graph normally used in showcasing a wholesome quantity; we have to show that how this whole quantity is broken into parts. The whole quantity depicts entire sample space and the pieces of pie in the circle graph are called sectors.

3. Bar Charts: This is a type of chart, which contains labeled horizontal or vertical bars showing a piece of information and an axis. The numbers along the side of bar graph compose the axis. This is also called as a histogram; Bar Graph is useful when there is a numerical comparison.

Tidak ada komentar:
Posting Komentar